The downward flux by the atmosphere is the same as the real greenhouse effect. This flux is excatly the same as the sum of four energy fluxes: LW radiation absorption 155.6 + SW radiation absotpion 75.0 + Latent heating 90.8 + 24.2 = 345.6 W/m2
ClimatExam Scientific analyses of the climate change and global warming by Dr. Antero Ollila


Cloud forcing
Traditional calculation method
The differences between sky conditions are due to the degrees of cloudiness in different skies. This effect is generally called cloud forcing (CF). Normally the cloud forcing has been calculated at TOA as the difference between clear sky and all-sky in pseudo-balance conditions. The albedo change is the difference between albedo fluxes of clear and all-sky values, which is -51.2 W/m2 (using the values of Ollila). The outgoing LW radiation decrease is the difference between OLRclear and OLRall-sky, which is 21.2 W/m2. According to the most common definition, the cloud forcing (CF) is the sum of these two fluxes, which in this case is -30.0 W/m2, a cooling effect. This value is close to the values used in other studies (Ohring and Clapp, Harrison et al., Ardany et al., Zhang et al., Raschke et al., Loeb et al., Stephens et al.), which vary between -17.0 and -28 W/m2 average being -23.4 W/m2. Using the CF value of -30 Wm-2 and the cloudiness change 66% between clear and all-sky, the CS (Cloudiness Sensitivity) would be -0.46 Wm-2/CL-%. It should be noticed that the calculation of CF with the traditional method is sensitive for small errors in SW and LW flux values.
Spencer and Braswell have created a more complicated calculation method for cloud forcing by separating causes and effect of the clouds. Their final conclusion is that clouds have a negative impact on the surface temperature. Dressler has analyzed the TOA radiation budget in response to short-term climate variations from the years 2000 to 2010, and his results showed positive feedback of the clouds. So the issue of cloud forcing still remains unclear without common acceptance and understanding.
The author’s approach is to use the results of the energy balance calculations and the analyses of the dynamic behavior of the climate system. On the global scale, the climate is in the all-sky condition. Locally the sky can be clear or cloudy for shorter or longer periods. Actually the global values of the clear and cloudy skies have been calculated by combining locally measured flux values because on the global scale the real clear and cloudy skies do not exist.
Cloud forcing according to the energy balance of the Earth
The simplest possible way to analyze the cloudiness and albedo effects on the surface temperature is through the total energy balance of the Earth equalizing the absorbed and emitted radiation fluxes according to the following equation
SC * (1-α) * (¶*r2) = s * T4 * (4 * ¶*r2), (2)
where, SC is solar constant (1368 W/m2), α is the total albedo of the Earth, s is Stefan-Bolzmann constant (5.6704*10-8), and T is the temperature (K). The temperature Ta can be calculated from this equation:
Ta = (SC * (1 – α) / (4 * s))^0.25 (3)
where Ta is the temperature corresponding the emitted LW flux. The average albedo according to this study values (Ollila) is 104.2/342 = 0.30468. Using this albedo value, the temperature Ta would be -18.7 °C according to equation (3). Using this temperature and the Planck’s equation, the emitted LW radiation flux of the Earth would be 237.8 W/m2, which is the measured value of OLR and the same as used in this study. The temperature Ta calculated according to Equation (3) is not the actual surface temperature of the Earth but the temperature at a certain level in the atmosphere corresponding to the LW radiation flux emitted by the Earth’s atmosphere into the space. The most common global temperature of the Earth calculated as the average value of the surface measurements is 15 °C which means that the greenhouse effect would be 33.7 °C. Because Equation (3) does not include the GH effect, the surface temperature Ts has been taken into account by adding 34 K into Ta
Ts = Ta +33.7 (4)
The Earth’s albedo depends mainly on the cloudiness. Ollila7 has used the following values of cloudiness and albedos for clear, all-sky and cloudy sky conditions: (0%, 53/342), (66%, 104.2/342), and (100%, 120/342). The second-order polynomial can be fitted through these points and the result is
α = 0.15497 + 0.0028623 * CL – 0.000009 * CL^2 (5)
where CL is cloudiness-%.
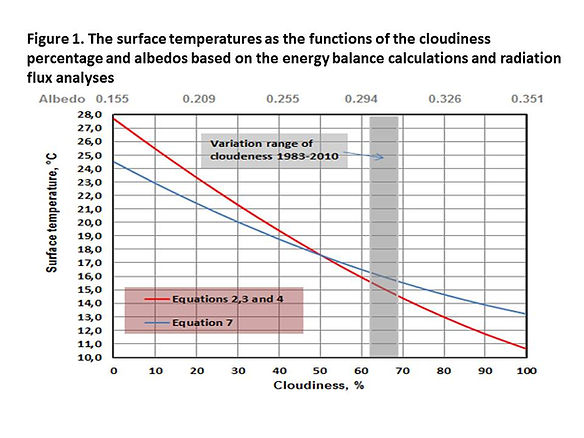
The surface temperatures Ts can be now calculated according to equations (3) and (4) by using the different cloudiness (CL) and the albedo values of equation (5). The minimum and maximum values of the Earth are 10.6 °C and 27.7 °C, which gives the average CS of 0.171 °C/CL-% or 0.471 Wm-2/CL-% over the whole cloudeness range. The graphical presentation of the surface temperature as the function of cloudiness and albedo is depicted in Figure 1.
Cloud forcing according to the radiation flux analyses
Ollila has calculated the balance values ulitilizing radiation fluxes developed for clear and cloud sky. Utilizing these balance values of the different skies (222 W/m2, 237.8 W/m2 and 289 W/m2), a graph can be prepared where the differences of the net incoming SW flux (NSR) are functions of the cloudiness percentage. The surface temperatures follow the same relationship for the three different skies (13.2 °C, 15.9 °C and 24.5 °C).
Using these three points of the different skies, a mathematical fitting can be made showing a slight nonlinear dependency. Proper fittings are second-order curves, which are the following polynomials:
CFF = -0.98105* CL + 0.0031105 * CL^2 (6)
CFT = 24.5 – 0.16389 * CL + 0.0005089 * CL^2 (7)
where CFF is the cloud forcing in W/m2, CFT is the cloud forcing in °C, and CL is the cloudiness percentage. The surface temperature according to Equation (7) is also depicted in Figure 1. The differences between the surface temperatures of the two curves in Figure 1 are due to the different calculation bases. In Equation (4) the surface temperature is based on the global temperature measurements. The temperature of Equation (7) is based on the measured LW flux values emitted by the Earth’s surface. The difference is 15.9 °C – 15.0 °C = 0.9 °C when the cloudiness is 66%. The explanation for this difference is in the accuracies and methods applied in calculating the average global values.
The cloudiness forcing can be calculated over the whole range from 0% to 100% and the cloud forcing values would be 0.67 Wm-2/CL-% or 0.113 °C/CL-% (24.5 °C – 13.2 °C). In reality the average global cloudiness can be estimated to vary in the range from 60% to 70%, as can be seen from the behavior of the cloudiness during the last 30 years. That is why a linear fitting is a good estimate in this limited range. The angle coefficients of these fittings are -0.564 W/m2 per CL-% and -0.096 °C/CL-%. These values are the CF values for the cloudiness changes, assuming that the change has settled to another level during the longer time period. This time span is about one year, based on the time constants of land and sea as previously analyzed.
Analyses of different cloud forcing values
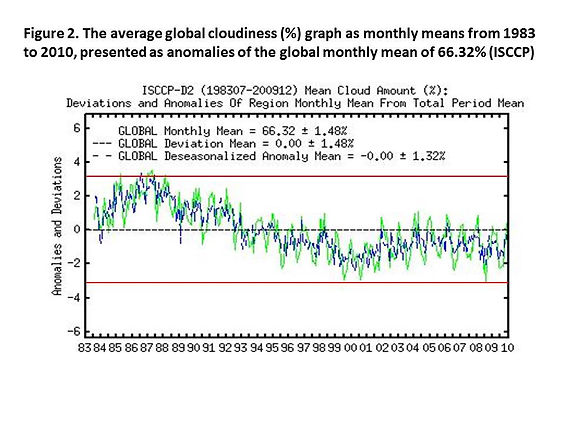
Figure 2 presents a graph of the cloudiness trend copied from the website of ISCCP24 (International Satellite Cloud Climatology Project).
In Figure 2 we can see that the cloudiness is a variable, which may proceed from one value to another value through the whole dynamic process because the change in the cloudiness level may take years.
Analysis of different cloud forcing values
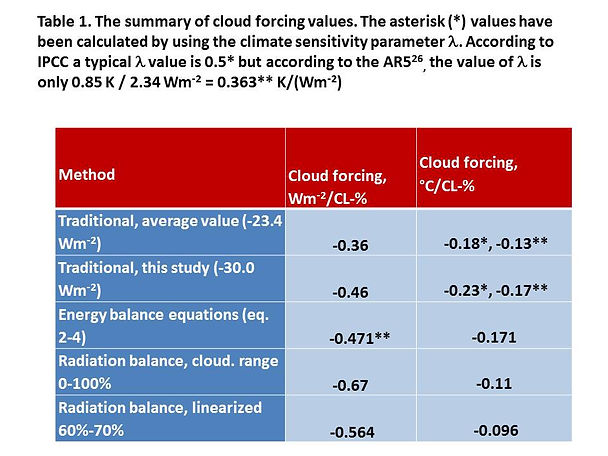
In Table 3 is a summary of different cloud forcing values calculated by different methods.
Table 3. The summary of cloud forcing values. The asterisk (*) values have been calculated by using the climate sensitivity parameter l. According to IPCC25 a typical l value is 0.5* but according to the AR526, the value of l is only 0.85 K / 2.34 Wm-2 = 0.363** K/(Wm-2) .
The difference between 0.36 W/m2 and 0.46 W/m2 calculated in the traditional way is due to the different SW and LW flux values measured at TOA. These flux values are measured in clear and all-sky conditions. The final result is that clouds should have a negative impact on the surface temperature. At the same time the measured LW fluxes emitted by the surface show that the all-sky LW flux upward is 395.6 W/m2 corresponding to a temperature of 15.9 °C and the clear sky values are 394.1 W/m2 and 15.6 °C. If we compare the cloud impacts and the real surface temperatures, there is a most profound contradiction: the cooling effect of CF has caused the increased surface temperature!
The explanation is in the dynamical delays of the climate system. The pseudo-balance values as depicted in Table 2 show that the real measured values of the upward LW radiation fluxes from the surface (and the surface temperatures) move in the beginning toward the opposite direction when compared to the final change. As previously analyzed, this behavior is due to the warming effects of clouds at night and the heat capacity of the atmosphere. This state is temporary and will vanish in about one week. This dynamic behavior may lead to the wrong conclusion that an increase in cloudiness has a positive impact on the surface temperature, which is not possible in the long run.
A theoretical problem in calculating the CF in the traditional way is the OLRclear value of the clear sky (259 W/m2), which is actually a pseudo-balance value caused by the cloudiness change from 66% to 0%. The real CF is same as the net SW radiation change, which is 289 - 237.8 = 51.2 W/m2 in the cloudiness range 0-66% and 289 - 222 = 67 W/m2 in the cloudiness range 0-100%. As shown above, the change needs time, because the surface temperature has increased at the same time as the CF has caused a cooling effect. Using the pseudo-balance OLRclear value of the clear sky is simply not the right choice in calculating cloud forcing, because this OLRclear flux is not a direct forcing but it is a result of the real forcing caused by SW radiation change.
The author’s choice is to calculate the CF value by applying the total SW radiation change caused by cloudiness change, to use true balance values, and to calculate the CF for cloudiness percentage in the cloudiness range from 60% to 70%, which is the normal range of cloudiness variation. The value of the climate sensitivity parameter l seems to vary in IPCC’s reports and which means that the right value of l is still unclear.
There is a difference, if compared 0.171 °C/CL-% to the value of 0.11 °C/CL-%. The latter value is based on the GH effect calculations in the atmosphere but the radiation balance equations (2-5) does not take GH effect into account and in this respect the CS value of 0.171 °C/CL-% can be assessed to be more theoretical. The CF value of 0.67 Wm-2/CL-% is 45.6% bigger than the 0.46 Wm-2/CL-% calculated on the traditional way. This difference is same as is the difference between pseudo-balance and true balance values of radiation fluxes at TOA.
A short analysis can also be carried out to find out whether a cloudiness change could have a role in global warming. According to IPCC, the historical warming till 2005 has been 0.76 °C. Applying the cloud forcing value 0.01°C/CL-% of this study, the cloudiness-% decrease of 7.6 % is needed for the same increase if no other impacts have been included. This kind of change may be possible if compared to the trend graph of Figure 2. If the energy balance value is the applicable value, i,e the real new energy balance state is achieved after a cloudeness change, then only 5 % cloudeness change is needed.


References
D.H. Douglass, B.D. Clader, R.S. Knox, Meeting at 2004 Solar Radiation and Climate (SORCE) on Decade Variability in the Sun and the Climate, Meredith, New Hampshire, October 27-29.
N. Scafetta, J.Atm. Sol.Terr. Ph., 2009, 71, 1916.
S.E. Schwartz, J. Geophys. Res., 2007, 112, D24S05.
J. Hansen, A. Lacis, D. Rind, G. Russell, P. Stone, I. Fung, R. Ruedy, J. Lerner, J. Geophys. Mon. Ser., 1984, 29, 130.
A.R. Stine, P. Huybers, I.Y. Fung IY, Nature, 2009, 457, 435.
J. Esala, Licenc. Thesis, 2005, University of Helsinki, Finland.
A. Ollila, Devel. in Earth Sc., 2013, 1, http://www.seipub.org/des/paperInfo.aspx?ID=11043.
A. Bodas-Salcedo, M.A. Ringer, A. Jones, J. Climate , 2008, 21, 4723.
E. Raschke, A. Ohmura, W.B. Rossow, B.E. Carlson, Y-C. Zhang, C. Stubenrauch, M. Kottel, M. Wild, Int. J. Clim., 2005, 25, 1103.
N.G. Loeb, B.A. Wielicki, D.R. Doelling, G.L. Smith, D.F. Keyes, S. Kato, N. Manalo-Smith, T. Wong, J. Climate, 2009, 22, 748.
A. Ollila, Ener. & Envir., 2012, 23, 781.
A. Ollila, Dissertation of Lic. Techn.. 1974, Oulu University, Oulu, Finland.
J. Kauppinen, J.T. Heinonen, P.J. Malmi, Int. Rev. Ph., 2011, 5, 260.
C.N. Long, Fifteenth ARM Science Team Meeting Proceedings, Daytona Beach, Florida, March 14-18, 2005.
ARM, ARM Data Archive, 2012, Atmospheric Radiation Measurement (ARM) Program. http://www.archive.arm.gov/armlogin/login.jsp.
A. Ohmura, J. Appl. Met., 1997, 40, 753.
G. Ohring and P.F. Clapp, J. Atm. Sc., 1980, 37, 447.
E.F. Harrison, P. Minnis, B.R. Barkstrom, V. Ramanathan, R.D. Cess, and G.G. Gibson, J. Geophys. Res., 1990, 95, 18687.
P.E. Ardanuy, L.L. Stowe, A. Gruber, M. Weiss, J. Geophys. Res., 1991, 96(D10), 18537.
G.L. Stephens, J. Li, M. Wild, C.A. Clayson, N. Loeb, S. Kato, T. L’Ecuyer, P.W. Stackhouse Jr., M. Lebsock, T. Andrews, Nat. Geosc., 2012, 5, 691, DOI: 10.1038/ngeo1580.
R.W. Spencer, W.D. Braswell, J. Geophys. Res., 2011, 115, D16109, doi:10.1029/2009JD013371.
A.E. Dessler, Science, 2010, 330: 1523-1527, DOI: 10.1126/science.1192546.
ISCCP, The ISCCP D2 cloudiness image, 2012, http://isccp.giss.nasa.gov/info.html.
IPPC, Fourth Assessment Report (AR4), The Physical Science Basis, Contribution of Working Group I to the Fourth Assessment Report of the Intergovernmental Panel on Climate Change, Cambridge University Press, Cambridge, 2007.
IPCC, Fifth Assessment Report (AR5), The Physical Science Basis, Working Group I Contribution to the IPCC Fifth Assessment Report Climate Change 2013, Summary for Policymakers, 2013.
IPPC, Summary for Policymakers, IPCC Fourth Assessment Report (AR4), The Physical Science Basis, Contribution of Working Group I to the Fourth Assessment Report of the Intergovernmental Panel on Climate Change, Cambridge University Press, Cambridge, 2007.
A.A. Lacis, G.A. Schmidt, D. Rind, R.A. Ruedy, Science, 2011, 330, 356.